Last Orders for Evidence: The Shaky Case Against Alcohol Advertising
Last Orders for Evidence: The Shaky Case Against Alcohol Advertising
Christopher Snowdon // 27 May 2026
A study published in BMJ Public Health has claimed that Lithuania’s ban on alcohol advertising led to a 35% reduction in teenage drunkenness. This is a trifle surprising because other studies of alcohol advertising bans have generally found little or no effect on anything.
The study uses data from the European School Survey Project on Alcohol and Other Drugs, in which 15–16-year-olds self-report their alcohol intake. The authors look at trends in Lithuania and several other countries since 2007 and claim that, since 2018, when the alcohol ad ban took effect, Lithuania has seen a bigger decline in the frequency of intoxication among this age group than its peers.
The first thing to say about this is that intoxication among 15–16-year-olds in any of the countries is not very common. As this graph from the study’s appendix shows, most of these kids never get drunk and most of those who do only get drunk once a year. (Symptoms of drunkenness in the survey include “staggered when walking, not being able to speak properly, throwing up or not remembering what happened”.)
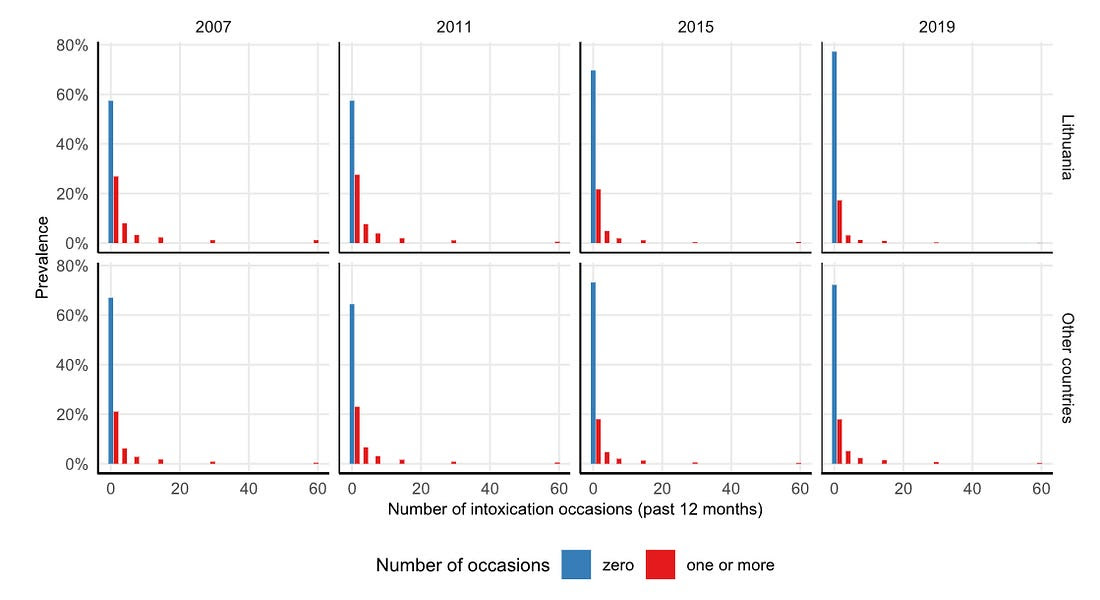
Therefore, the (mean) average frequency of intoxication per annum - which is what the authors focus on - is quite a small number. By 2019, it was below 1.5 in all six countries.
As we shall see, it is not at all clear from this study what actually happened in any of these countries, but what appears to be the data from the four surveys (2007, 2011, 2015 and 2019) is shown in Figure 1 of the study. The trend is down everywhere except in Italy, where it was low to begin with.
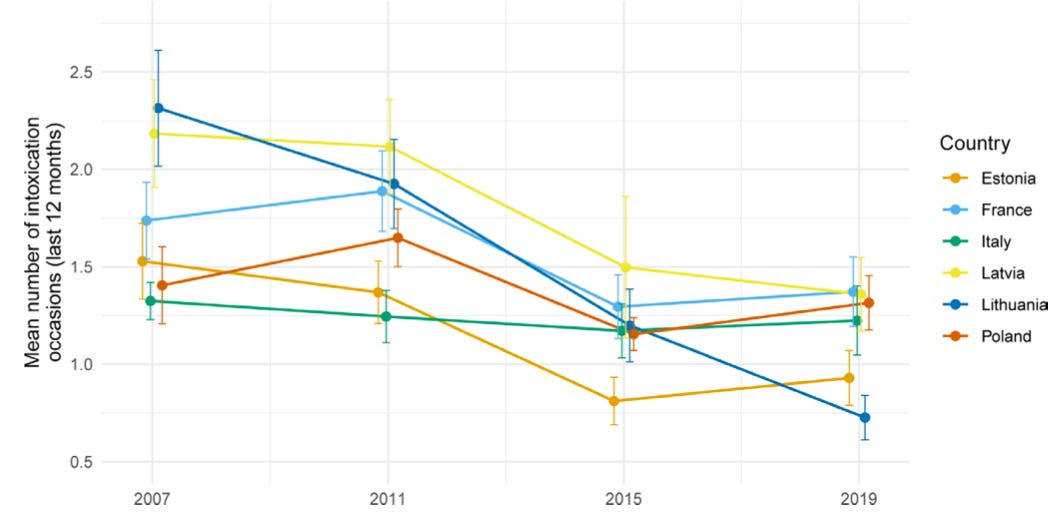
The authors say that: “Overall, levels remained relatively stable between 2007 and 2011”. That might be true overall, but it does not apply to Lithuania, where the rate clearly fell. It fell again between 2011 and 2015 and then again between 2015 and 2019. The rate of decline was pretty consistent over the whole period. Would the decline have come to a halt if Lithuania hadn’t banned alcohol advertising in 2018? That is essentially the authors’ claim, but it is hard to prove it with this survey.
Later in the study, we are shown Figure 2. This also purports to show the mean number of intoxication occasions in the last 12 months, but the graph looks rather different.
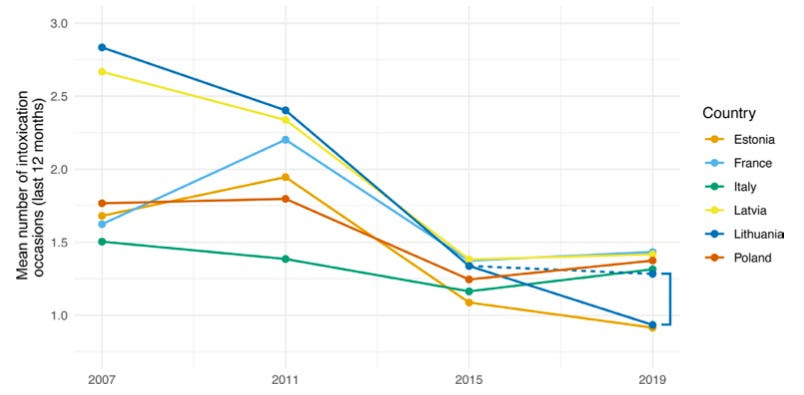
In this graph, Lithuania still sees a decline in teen drunkenness, but the rate of decline is less steep between 2015 and 2019 - when the ad ban took effect - than it was between 2007 and 2015. The dotted line shows the authors’ counterfactual in which the advertising ban never happened. Without the ban, they surmise, there would have been almost no change in teen drunkenness between 2015 and 2019. But since there was a decline between 2015 and 2019, the advertising ban must have worked. QED!
At this point, the reader is starting to wonder what is real and what is not. Are the results of the survey shown in Figure 1 or Figure 2? Or neither?
The plot thickens in the appendix, where the authors talk us through their adjustments, although they do not really explain them. They begin by showing how the data looked when it was only adjusted for the “secular trend”. God knows what that involved in practice, but the word “predicted” in the title indicates that we are already in the world of modelling.
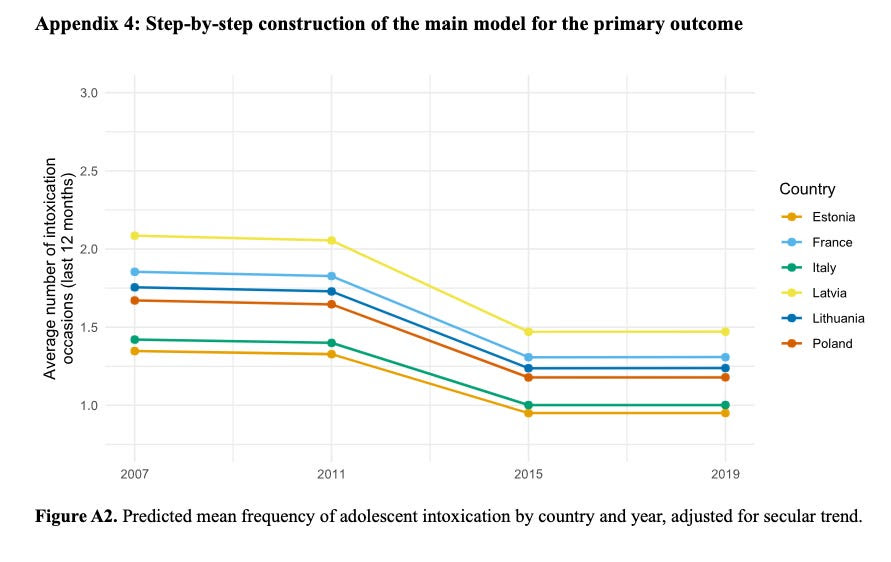
This graph looks completely different to the graphs above. Here, the trend is remarkably similar in all six countries. There was a decline in teen intoxication everywhere, but it nearly all happened between 2011 and 2015. All the countries ended in the same position as they began, relative to each other, and Lithuania is in the middle of the pack.
They then make adjustments for “individual-level differences (gender and social behaviours)”…
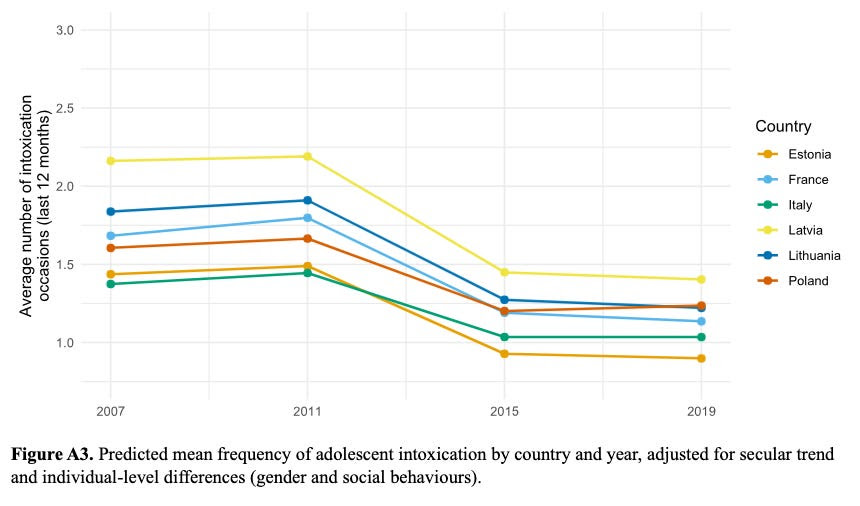
And then they make adjustments to account for “differences in self-perceived availability of alcoholic beverages”…
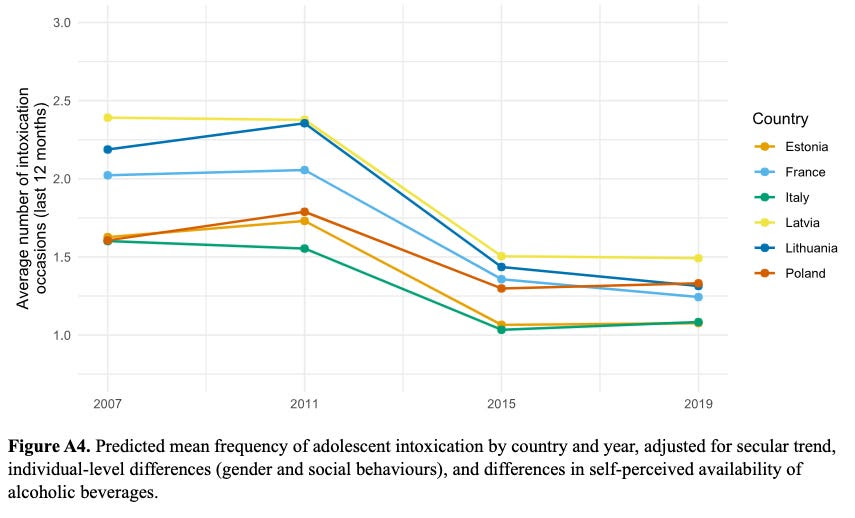
And then “alcohol control policies other than marketing (taxation and personal control)”…
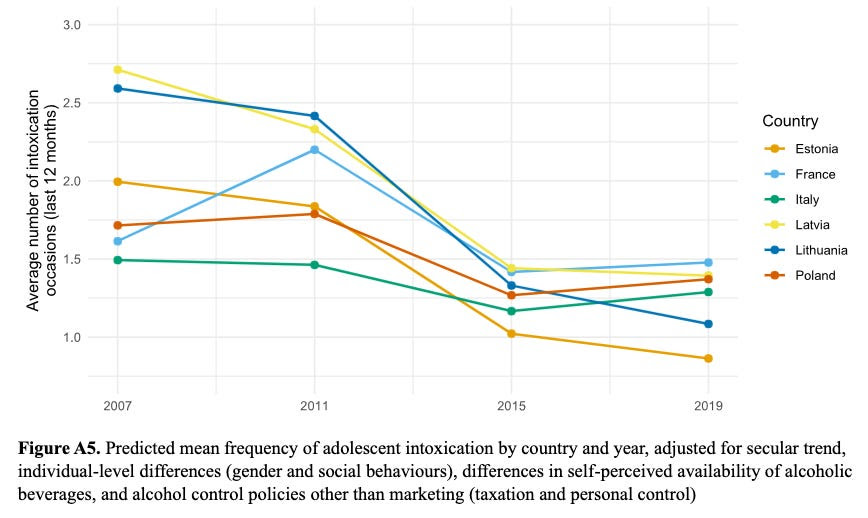
And finally, they adjust for “alcohol marketing”, leaving them with the final model that appears in the study as Figure 2. This is the graph to which they add their counterfactual and declare victory.
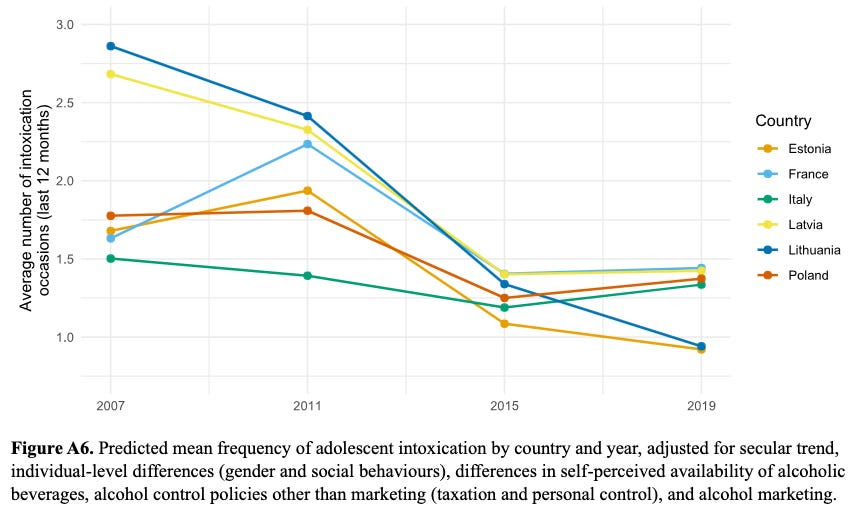
As you can see, the various adjustments completely transform the data, and we are still none the wiser about what the survey actually found. Has there really been a big drop in teen intoxication in Lithuania, or is it all relative to a counterfactual based on the authors’ assumptions about how 15–16-year-olds respond to the availability, price and advertising of alcohol?
There are plenty of valid reasons to make adjustments to data. A pollster might weight the findings of a survey according to past voting intentions, gender, age and other relevant factors if certain people are under-represented in the poll, but that is not what the authors are doing in this study. An epidemiologist looking for a causal association with a lifestyle risk factor might adjust the statistical association to account for known risk factors such as smoking. That is perfectly justifiable, but again, it doesn’t seem to be what the authors are doing here.
Moreover, the authors are adjusting for things that are murky, largely unknowable and arguably unnecessary. Why would you adjust for the secular trend, i.e. what has happened in the past? What does adjusting for “social behaviours” even mean? And how can you adjust for the effect of marketing when you don’t know what the effect of marketing is? (The authors admit in the introduction that “real-world evaluations of full marketing bans remain limited” and that “a 2014 Cochrane Review and a more recent literature review identified insufficient evidence for the effectiveness of alcohol marketing bans”. It is precisely because we don’t know what effect marketing bans have that the authors conducted the study!)
The confusion is made worse by the fact that Lithuania raised the drinking age from 18 to 20 at the same time as it banned alcohol advertising. It also restricted the hours that off-licences can open. How can you isolate the effect of any of these policies when all you have are two surveys, taken four years apart, in which teenagers are asked to fess up to doing something that most of them never do and that most of those who do only do once a year? The only way to even attempt such a task is by piling one untested assumption upon another until the data is unrecognisable.
I have no problem believing that teen drunkenness has declined in Lithuania since 2007, as it has in most other European countries. Lithuania has become a more sober country in general, albeit starting from a very high base. The number of 15–16-year-olds in Lithuania who have got drunk in the past year has certainly declined, making it highly likely that the “mean frequency of adolescent intoxication” has also fallen. But the claim that the ban on alcohol advertising had anything to do with that - let alone that it single-handedly cut teenage intoxication by 35%! - is entirely fanciful and cannot possibly be proven by the source data for this study.
The authors nevertheless conclude…
This study provides real-world evidence that a full national ban on alcohol marketing can reduce risky drinking behaviours among adolescents. To our knowledge, this is one of the few studies that have empirically demonstrated such an impact.
But it is not real-world evidence, is it? It is a scenario at best. Nothing has been “empirically demonstrated”. I have read the study several times, and I am still unclear about what actually happened in any of the six countries.
Following Lithuania’s 2018 ban, we observed a large decline in the prevalence and frequency of alcohol intoxication among adolescents protected by this ban…
This is not true. They have not so much “observed” anything as hypothesised it. The relevant survey data comes from 2015 and 2019. It doesn’t tell us what happened “following Lithuania’s 2018 ban”. The decline - if there was a decline - could have happened between 2015 and 2017 for all we know.
If we want some empirical evidence that hasn’t been distorted beyond recognition, we can look at per capita alcohol consumption in Lithuania. This data, from the WHO, shows a steep decline in alcohol consumption between 2012 and 2018, followed by a rise in the years since. On the face of it, this does not suggest that any of the policies that took effect in 2018 had much of an impact on drunkenness.
Lithuania has sat near the top of EPICENTER and the IEA's Nanny State Index, a ranking of EU member states by the severity of their lifestyle regulations on alcohol, tobacco, vaping and food, in every edition since the 2018 restrictions came in, making it a poster child for the kind of paternalistic regulation that the WHO and the European Commission are keen to spread across the continent. Papers like this BMJ Public Health study feed the policy machinery in Geneva and Brussels that justifies tighter rules on advertising, availability and price, often on the thinnest of evidentiary bases. If work this shaky is taken at face value, expect them to lean harder on other member states to follow the Lithuanian template, regardless of whether it actually changed anyone's drinking habits.
Dr Christopher Snowdon is the Head of Lifestyle Economics at the IEA. He has a degree in History from Lancaster University and a PhD in Economics from the University of Buckingham. He is the author of Killjoys, The Art of Suppression, The Spirit Level Delusion, and Velvet Glove, Iron Fist. His work focuses on lifestyle regulation and evidence-based policy-making. He has authored dozens of IEA publications including Sock Puppets, Cheap as Chips, A Safer Bet, and You Do Not Exist, and is the editor of the Nanny State Index
EPICENTER publications and contributions from our member think tanks are designed to promote the discussion of economic issues and the role of markets in solving economic and social problems. As with all EPICENTER publications, the views expressed here are those of the author and not EPICENTER or its member think tanks (which have no corporate view).