Economic Performance Dashboard

Economic Performance Dashboard
Diego Sánchez de la Cruz // 28 February 2024
In an effort to measure the performance of the 27 economies in the European Union over the past five years, the Juan de Mariana Institute has crafted the Economic Performance Dashboard. This new report documents the behaviour of EU-27 member states from 2019 to 2023, focusing on five key variables: GDP growth, reduction of the unemployment rate, control of public debt, the evolution of household disposable income, and moderation of tax pressure.
The results obtained are displayed in the following table.
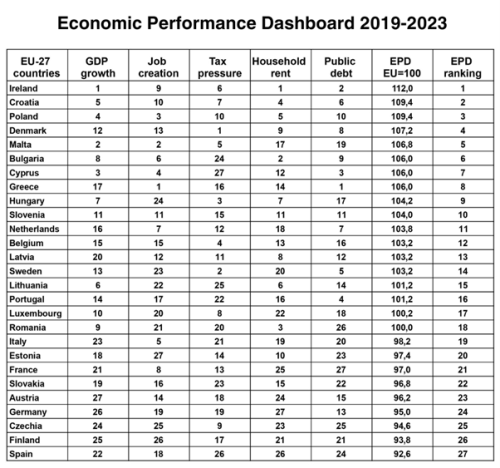
As can be seen, the country with the best performance is Ireland, which is 12 points ahead of the community average and ranks first in two out of the five variables studied. Croatia and Poland complete the top three positions in the index.
At the bottom of the table, we find Spain, which obtains the worst result in the Economic Performance Dashboard and scores over 7 points below the community average. Other partners such as Finland or Czechia also appear in negative positions.
Italy, France, and Germany occupy discrete positions, ranking 19th, 21st, and 24th, respectively, so the poor figures exhibited by the EU-27 for the last five years are closely related to the poor performance of its four largest economies, all of which are located at the bottom of the table, with Spain standing out as the worst member of the club.
The opportunity cost of poor economic performance is quite significant. In the case of the Iberian country, it is estimated that being more than 7 points below the average results in an aggregate impoverishment of 170 billion, due to a lower GDP, higher unemployment rate, higher debt, lower household income, and higher tax pressure.
What does the ranking indicate?
It is important to analyse the index carefully, as its conclusions reflect the evolution from 2019 to 2023 but not the overall situation of countries. For example, Hungary ranks third in the tax pressure measurement, while Estonia appears in the fourteenth position in that classification. However, this does not mean that Hungary’s fiscal model surpasses the highly competitive tax scheme of the Baltic country. Rather, it indicates that between 2019 and 2023, the reduction in tax revenues was greater in the former case than in the latter, which could be explained because Hungary is coming from a more unfavourable position.
In terms of fiscal policy, tax revenues remained more or less stable across the European Union from 2019 to 2023. Therefore, it is surprising and positive that countries such as Denmark or Sweden, where taxes remain very high, have at least seen a decrease in the tax burden over the last five years, suggesting prospects for future advancements. Among Scandinavian economies, it should also be noted that Finland’s poor economic performance from 2019 to 2023 comes right before the recent government change, which should incentivise ambitious reforms in the next four years.
When the results obtained are grouped based on the five criteria employed, we find that the overall positions on the Economic Performance Dashboard are largely similar to the rankings obtained in the different measures analysed. This seems to suggest that reformist cycles produce positive effects that feed back into each other. For example, controlling public debt helps to moderate tax pressure, which in turn improves household disposable income and growth prospects, resulting in an improvement in employment as well. Similarly, debt mismanagement leads to tax hikes that reduce households’ purchasing power and negatively affect growth, thereby undermining job creation capacity.
Policymakers can use the Economic Performance Dashboard as a reference tool to measure which countries performed better in a period marked by the pandemic. From 2019 to 2023, the Irish economy once again confirmed its excellent performance, highlighting the success of a firmly liberal economic model, while Spain emerged once again as the sick man of Europe, in line with an excessively interventionist policy under the current coalition government, led by socialists and communists.
Methodology
The category dedicated to growth compares the increase in GDP from 2019 until the third quarter of 2023. The metric dedicated to job creation studies how much the unemployment rate has decreased from the beginning of 2019 until October 2023. The analysis of tax pressure compares the increase or reduction of tax revenues between 2019 and 2022 (final figures for 2023 are awaited). Purchasing power is measured by calculating the variation in per capita income in purchasing power parity, with data from 2019 to 2022, pending statistics for 2023. Finally, the evolution of debt is obtained by comparing the weight of public debt at the beginning of 2019 until mid-2023. The sources used are the statistical series of Eurostat and AMECO.
The full study is available in Spanish here.
EPICENTER publications and contributions from our member think tanks are designed to promote the discussion of economic issues and the role of markets in solving economic and social problems. As with all EPICENTER publications, the views expressed here are those of the author and not EPICENTER or its member think tanks (which have no corporate view).


